Technical Articles
Industries require energy management to control the spiralling costs on electricity bills. Small scale industries may have apprehensions on ROI if they go for a full-fledged Energy Management systems.
To use the continual improvement framework of PDCA (Plan - Do - Check - Act) for energy management, monitoring of existing energy usage is a must. As a first step towards this systematic approach, users can install L&T E&A’s 5000/6000 series Digital panel meter that comes with an inbuilt 8MB datalogger facility at their Incomer panel to start with. Based on the data analysis at Incomer level, they can plan to act on the energy guzzlers. For a comprehensive energy management system, they must use L&T E&A’s SmartComm EMS with ready to use analytics and reporting tools that will boost their energy conservation initiative.
8 MB of file storage can be translated as 29 parameters stored at 15 minutes interval daily is equivalent to approx. 2 years of time period. Below table shows data storage interpretation for number of days storage.
| Parameters | Data Log Interval | |||
| 15 Min | 30 Min | 45 Min | 60 Min | |
| No. of Days | ||||
| 1 | 10230 | 20460 | 30690 | 40920 |
| 2 | 6820 | 13640 | 20460 | 27280 |
| 4 | 4092 | 8184 | 12276 | 16368 |
| 9 | 2064 | 4092 | 6138 | 8184 |
| 14 | 1364 | 2728 | 4092 | 5456 |
| 29 | 682 | 1364 | 2046 | 2728 |
Smartlog is a free software utility tool to configure and download the data in an excel sheet.
| Meter Type | Software Utility Type | Connection Type |
| 5000 MFM series with RS 485 port | SmartLog - Com | Meter → Shielded twisted pair cable → RS485 to Ethernet convertor → CAT 6 cable → Laptop/PC. OR |
| 6000 Max Demand Controller series with RS 485 port | SmartLog - Ethernet | Meter → Shielded twisted pair cable → RS485 to USB convertor → Laptop/PC |
| 5000 MFM series with Ethernet port | Meter → CAT 6 cable → Laptop/PC |
Step 1: Install the software and configure the laptop for communication settings as per the convertor and utility used. Press save button to enable the other two tabs

Step 2: Go to Datalog settings for configuration of below aspects
Slave id: Select the correct slave id of the meter
Time interval: Select from options of 1m, 5m, 10m, 15m, 30m,1h, 2h, 5h, 8h, 12 h.
Total parameters: Select from options of 1,2,4,9,14,29
Parameter list: Select maximum of 29 parameters from a list of 295 parameters that includes Energy, Power, Voltage, Current, THD, Individual Harmonics, Demand, K factor, etc.
Press Read button to read the meter, select the total parameters required say 4 nos. Select parameters one by one and press add button. The parameters will get populated on the right-side Added parameters area. Configure all these by pressing ‘Write’ button. Post this action, data will log in the meter.


Step 3: To download this data, complete step 1 and then go to Download tab.
Select the slave id and start Download button.
Output will be in an .csv format (excel sheet) as shown below:


Few applications are listed below though not exhaustive:
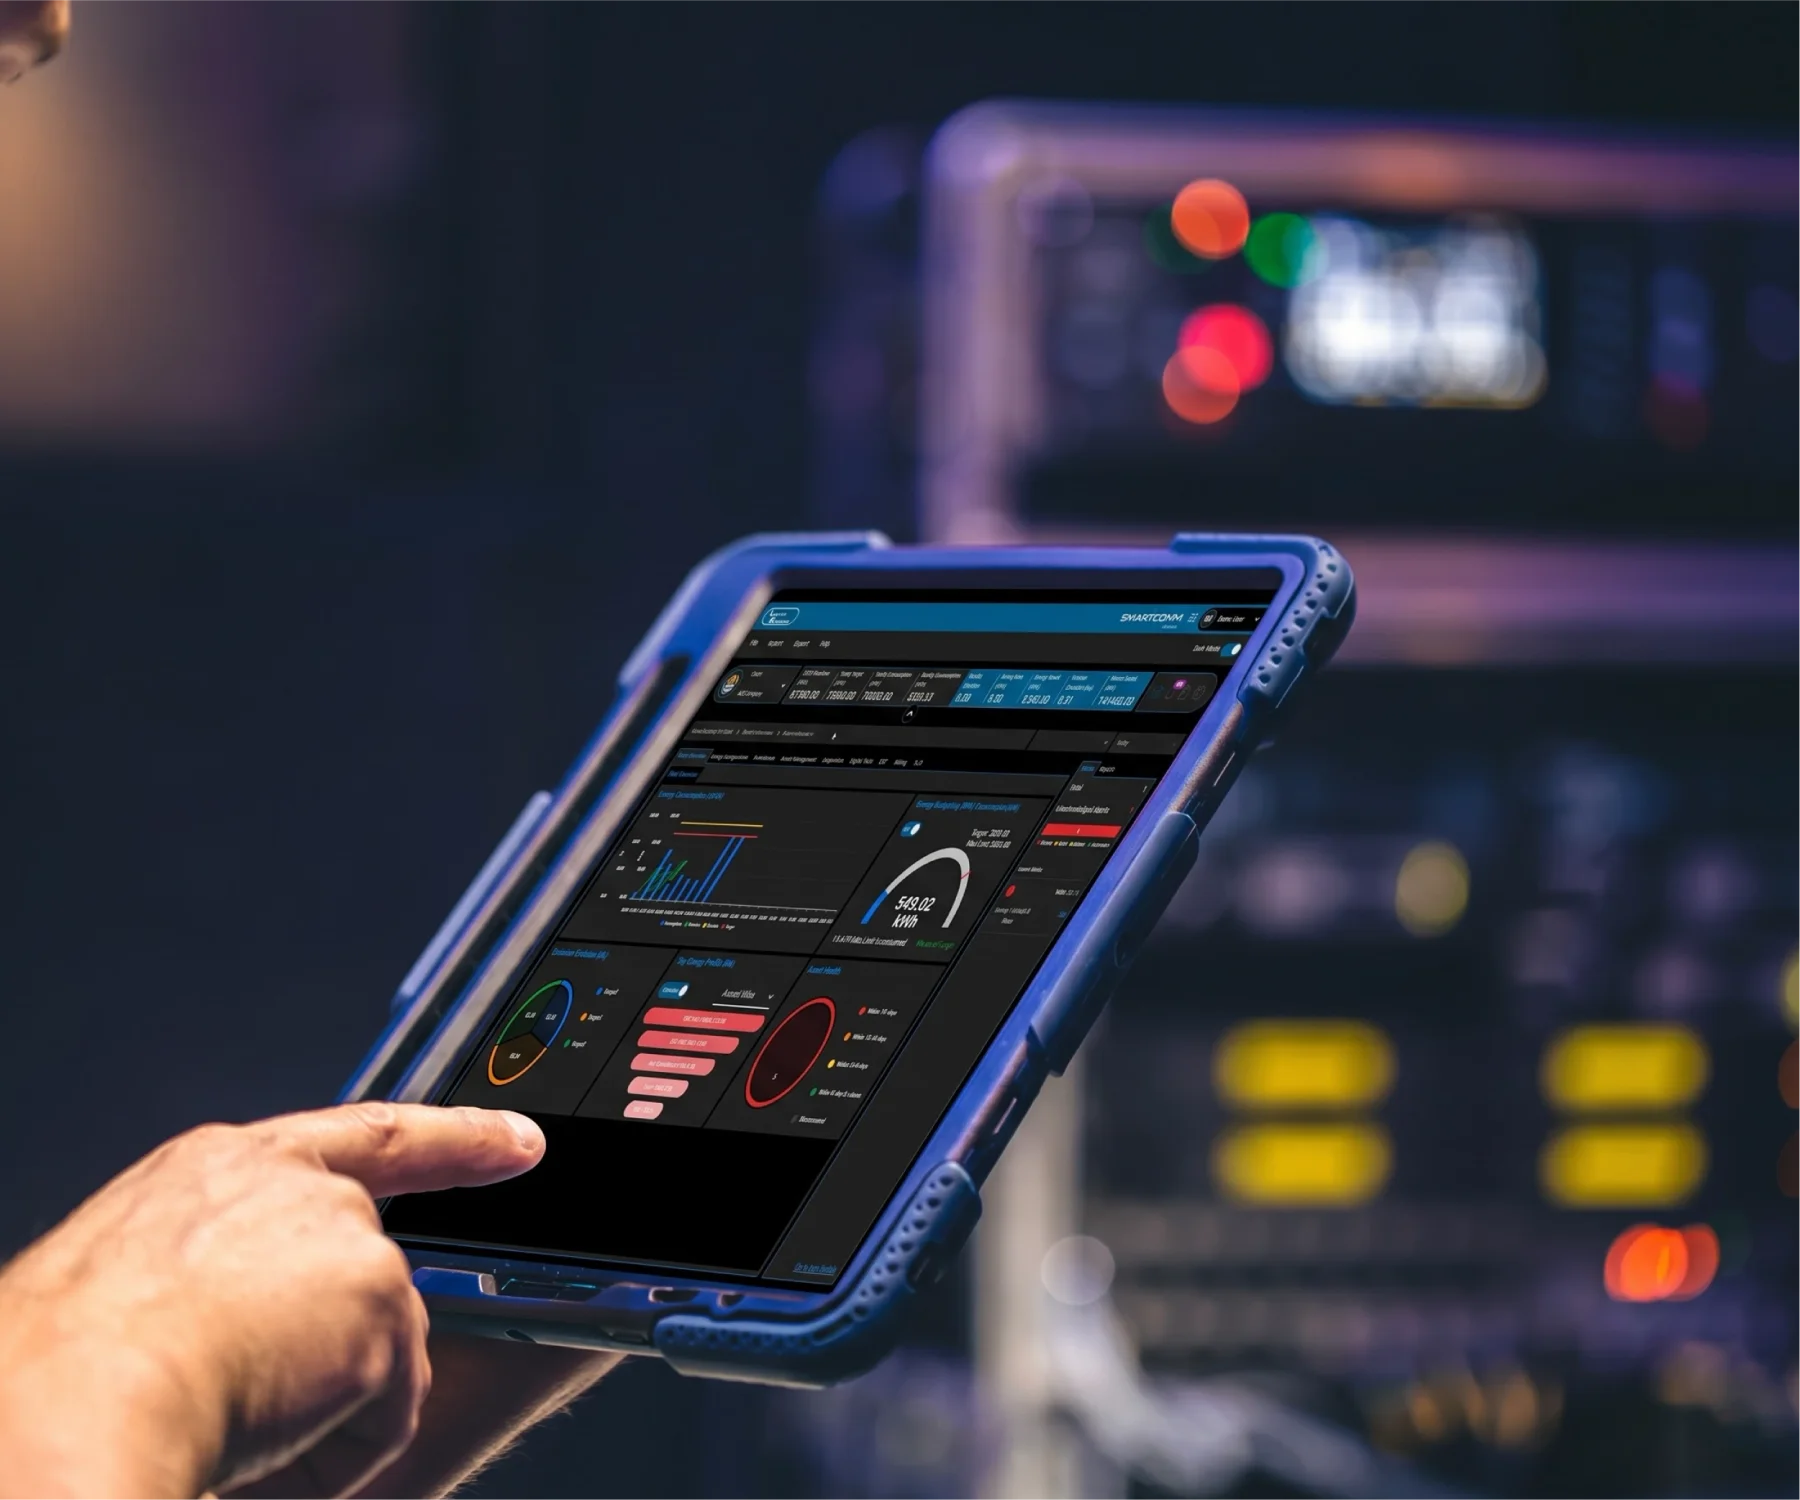
The next level approach will be to get a comprehensive report, trend analysis, email reports and analytics using SmartComm EMS.

Divyesh B. Vaghasiya,
Senior Product Management and Marketing professionalDivyesh B. Vaghasiya is a Senior Product Management and Marketing professional focused on Industrial IoT, Energy Management, and Smart Technologies. With 13+ years of experience in the electrical and automation industry, he combines deep technical knowledge with strategic business thinking. He shares perspectives on emerging technologies, product management, sustainability, and digital transformation, helping businesses navigate the evolving energy landscape.
Assistance Required?
Select an option to Contact Us

 Contact Us

